
More and more machine learning models are deployed to production every day. These models play a crucial role in deciding whether an individual will be authorized a loan they applied for, whether an intrusion detection system will detect suspicious network activity and even whether the car in front is at a safe enough distance. While the benefits of machine learning solutions are becoming apparent in a growing number of industries, many of these models are deployed to production without proper monitoring.
A stale model in production can cause significant harm both to the business using it, and to the individuals affected by the model’s prediction. Thus, monitoring machine learning models and detecting such issues early on is not a nice-to-have but a must. In this post we will discuss how to properly monitor machine learning models in production and thus reduce the potential risks and detect errors early on.
Why Is Monitoring ML Models Complicated?
Monitoring ML models is not such a straightforward task, and therefore it’s often not applied correctly, for multiple reasons. One reason for this is that it is not so simple to define an error since ML models by definition give probabilistic results. Another reason is that it may not be possible to calculate the evaluation metrics on real-world data since true labels are usually not available in real-time. And finally, Machine Learning is still a relatively young technology, and the bridge between Data Science and DevOps is still being constructed.
What Could Break Your Model?
Getting good results on the development set is important, but it is hardly enough. Running ML models in the real world poses a variety of challenges, which may cause model degradation. Following are some of the leading issues that come up:
Dev/Production data mismatch: Many ML models are trained on hand-crafted clean datasets. When these models are then applied to real-world data, they have poor performance due to this mismatch.
Data integrity issues: Think of the process the data goes through until being fed into your model. It may be coming from multiple sources, the format of the data may change over time, fields could be renamed, categories may be added or split, and more. Any such change can have a huge impact on your model performance.
Data drift and concept drift: Data in the real world is constantly changing. Social trends, market shifts, and global events affect each industry. These in turn may affect the distribution of the data that is being fed to your model, or that of the desired target prediction. And thus, the data we’ve trained our model on becomes less and less relevant over time.
We will discuss various methods for detecting each of these potential issues and locating the source of the problem automatically. To get a full picture of the model’s performance we will need to monitor each one of the relevant components over time, starting from the raw data, to engineered features and finally to model performance.
Monitoring Your Model
The most straightforward way to monitor your ML model is to constantly evaluate your performance on real-world data. You could customize triggers to notify you when there are significant changes in metrics such as accuracy, precision, or F1. If you find that there is a significant decrease in these metrics, it may indicate that there is a critical issue with your data or with your model.
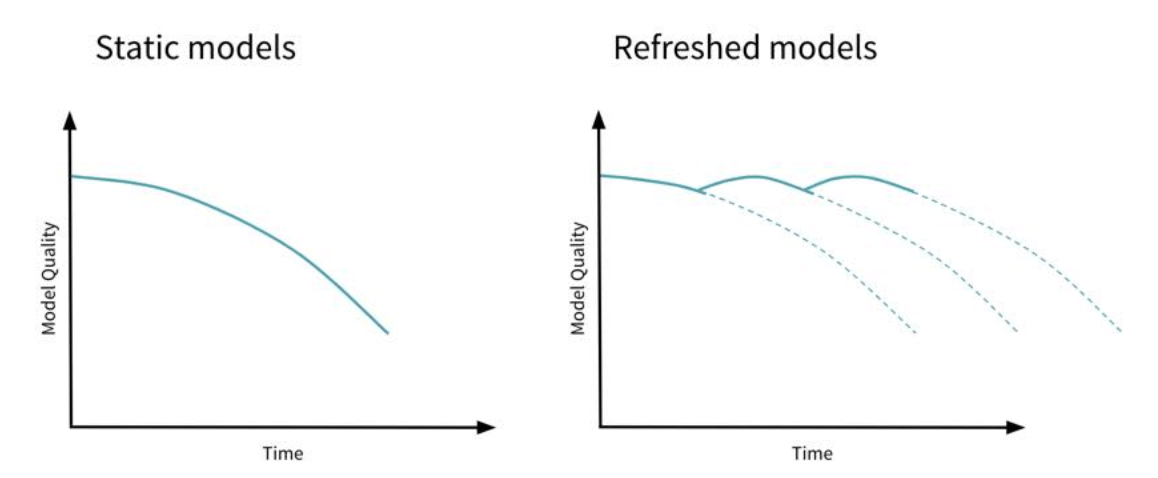
ML models tend to become stale over time, proper monitoring will help you determine when it is time to retrain your model (source)
Granular Monitoring
To gain more granular insights into your model’s performance, it is essential to continuously evaluate your model on specific data slices and examine per-class performance as well. If your model is customer-facing, you will want to ensure that your VIP users are having a good experience. Additionally, you could automatically identify slices with low performance to gain insight and improve your models. We recommend checking out slicefinder for detecting problematic slices automatically.
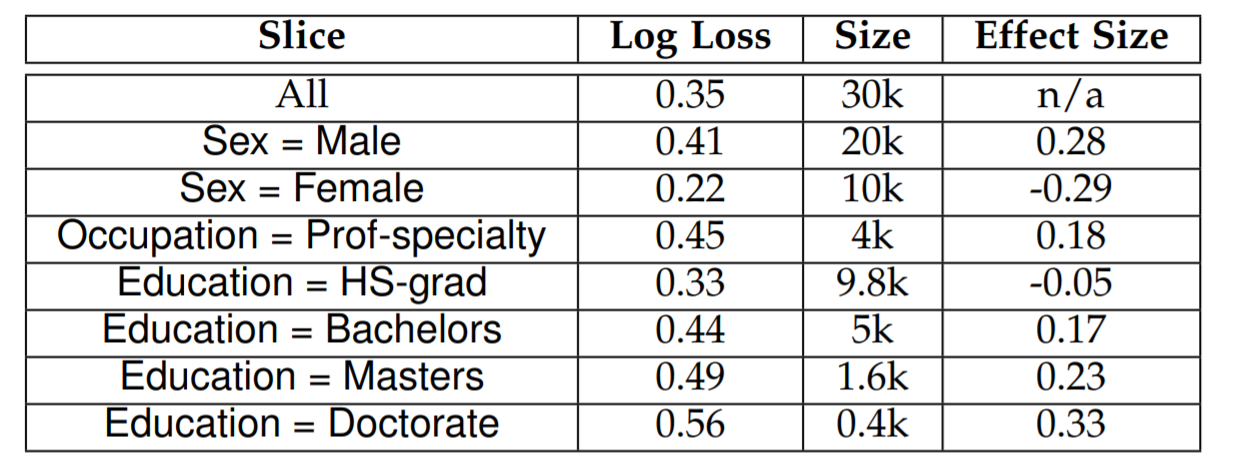
Detecting slices with poor performance can help you create more robust models easily (source)
Continuous Comparison
When there is a significant decrease in your model’s performance, it’s probably time to update it. But what if the model is still “okay”? To ensure we are getting the best performance we can, we recommend continuously comparing your production model’s performance with potential new candidates.
Training your full model from scratch may be a costly operation, and so we suggest training some simpler baseline models with low computational costs on new data as it flows in and using drifts in performance or in feature importance as indicators for some significant changes in the data that call for retraining.
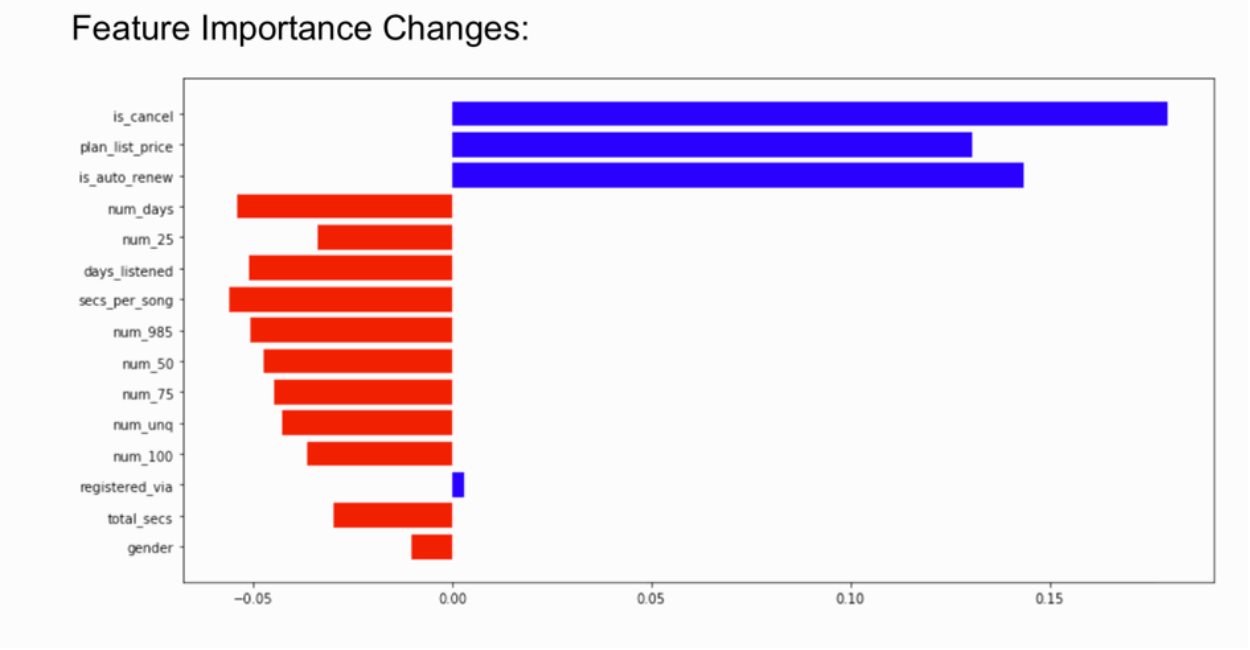
Shifts in feature importance can indicate that your model is underperforming. Source: Deepchecks
Dealing With Unknown Labels
By monitoring evaluation metrics, we can create a pretty good picture of the model’s status especially when evaluating many different slices of the data independently. However, it is important to note that for many applications the true labels are not available for production data in real-time. For cases like these, you will need to evaluate performance through proxy metrics such as comparing your model with a baseline model or an expert prediction. Additionally, by monitoring your data and your model’s predictions you may also be able to get a good indication for when your model’s performance may deteriorate, which can be useful when ground truth labels are not available immediately.
Monitoring Your Data
Monitoring your data and engineered features is essential for detecting when you might have an issue with your model and identifying the source of the problem. Remember, your model is only as good as the data it has been trained on, and so when there is a shift in the data distribution, we can’t expect the performance to remain as high as it once was.
“A machine learning model is only as good as the data it is fed”
- Reynold Xin, CTO at Databricks
Detecting Data Integrity Issues
This is a fairly simple step you could take that will save you a lot of heartache. Essentially we want to validate that the schema of the data in production is identical to the development data schema and that it does not change with time. This includes checking the consistency of feature names and data types, detecting new possible values for categorical data or new textual values, identifying missing values, and more.
The data pipeline can be very complex, and there can be a multitude of causes for each and every one of these changes. If a change like this in the data goes unnoticed, it’s bad news.
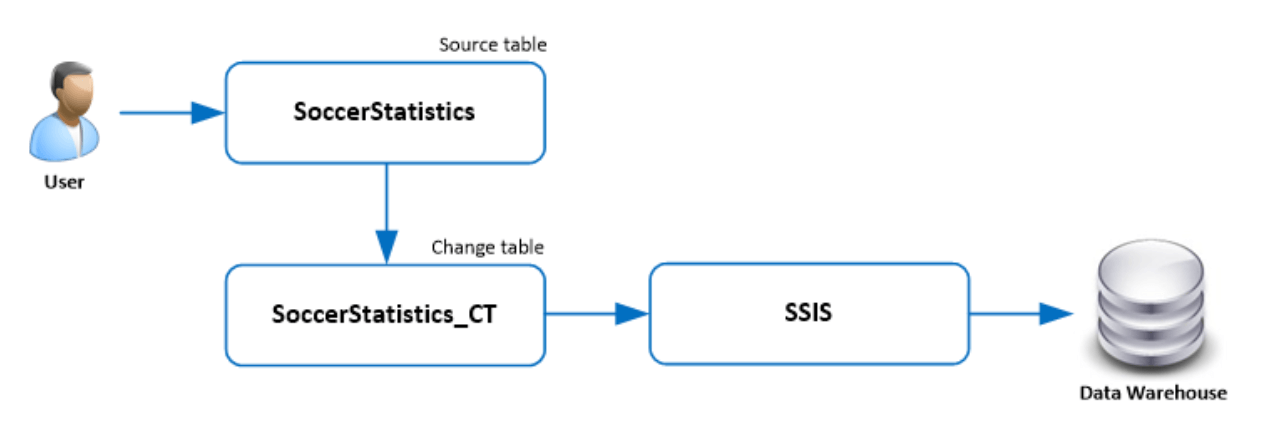
A simple change like renaming of a column can really break your model, and you should be the first to find out about it (source)
This following single line of code using pandas will notify you if any column names have been changed/added/removed, or if any column data types have changed:
assert df1.dtypes.equals(df2.dtypes)
Detecting Data Drift and Concept Drift
In order to detect concept drift we begin by selecting an appropriate drift detection algorithm. For streaming data, a popular choice is ADWIN (ADaptive WINdowing), while for batched data some popular choices are the Kolmogorov–Smirnov test, the chi-squared test or adversarial validation.
Next, we apply the selected algorithm separately to the labels, the model’s predictions, and the data features. Drift in any one of these categories may be significant in its own way. Drift in the labels, which is known as label drift indicates that there has been either a major data drift, or a concept drift. Similarly, drift in your model’s predictions also indicates a data drift on important features. Finally, drift in any of the features is worth noting as well, but for some features this may not have a strong effect on your model’s quality. In mathematical notation we have:
Example
We will show a basic example for detecting concept drift with the ADaptive WINdowing (ADWIN) algorithm, using the river Python library for online ML. We begin by defining three different distributions for the data which we then concatenate to reflect a signal that drifts over time. Think of the data as being the true labels, predictions, or individual features.
import numpy as np
import matplotlib.pyplot as plt
from matplotlib import gridspec
# Generate data for 3 distributions
random_state = np.random.RandomState(seed=42)
dist_a = random_state.normal(0.8, 0.05, 1000)
dist_b = random_state.normal(0.4, 0.02, 1000)
dist_c = random_state.normal(0.6, 0.1, 1000)
# Concatenate data to simulate a data stream with 2 drifts
stream = np.concatenate((dist_a, dist_b, dist_c))
Next, we plot the data:
# Auxiliary function to plot the data
def plot_data(dist_a, dist_b, dist_c, drifts=None):
fig = plt.figure(figsize=(7,3), tight_layout=True)
gs = gridspec.GridSpec(1, 2, width_ratios=[3, 1])
ax1, ax2 = plt.subplot(gs[0]), plt.subplot(gs[1])
ax1.grid()
ax1.plot(stream, label=‘Stream’)
ax2.grid(axis=‘y’)
ax2.hist(dist_a, label=r‘$dist_a$’)
ax2.hist(dist_b, label=r‘$dist_b$’)
ax2.hist(dist_c, label=r‘$dist_c$’)
if drifts is not None:
for drift_detected in drifts:
ax1.axvline(drift_detected, color=‘red’)
plt.show()
plot_data(dist_a, dist_b, dist_c)
Which results in the following graph:

On the left is the synthetic signal, while on the right are the histograms for sets drawn from each of the three distributions. As we can see the signal has two points with significant drift.
Finally, we try to detect the drift using the ADWIN algorithm.
from river import driftdrift_detector = drift.ADWIN()
drifts = []
for i, val in enumerate(stream):
drift_detector.update(val) # Data is processed one sample at a time
if drift_detector.change_detected:
# The drift detector indicates after each sample if there is a drift in the data
print(f'Change detected at index {i}')
drifts.append(i)
drift_detector.reset() # As a best practice, we reset the detector
plot_data(dist_a, dist_b, dist_c, drifts)
Output:
Change detected at index 1055
Change detected at index 2079

As we can see, the algorithm detected two shifting points that are pretty close to the actual points where the drift occurs.
Conclusion
Monitoring ML systems is an emerging field that is not yet fully developed. We have seen various methods for monitoring your model and your data in production, detecting potential issues, and identifying their root cause early on. The insights you develop using these methods will help you understand whether your data pipeline is broken, whether it’s time to train a new model, or whether you may continue working on your next project without worry.
Recent Comments