
Flag all your data quality issues by priority in a few lines of code
“Everyone wants to do the model work, not the data work” — Google Research
According to Alation’s State of Data Culture Report, 87% of employees attribute poor data quality to why most organizations fail to adopt AI meaningfully. Based on a 2020 study by McKinsey, high-quality data is crucial for digital transformations to propel an organization, past competitors.
Based on a 2020 YData study, the biggest problem faced by data scientists was the unavailability of high-quality data. The underlying problem in the rapidly evolving AI industry is apparent, and the scarcest resource in AI now is high-quality data at scale.
Despite realizing this, the industry has been focussing on improving models, libraries, and frameworks for years. Data scientists often see modeling as exciting work and data cleaning as tedious tasks. The neglected data issues compound to cause adverse downstream effects through the entire machine learning solution development.
Thankfully, we have seen a paradigm shift in the recent past, pioneered by Andrew Ng, moving from a model-centric approach to a data-centric approach. We’re witnessing data-centric competitions, awareness in the community. We’re marching in the right direction.
However, the problem persists; there’s still a lack of industry-ready tools to understand the underlying data quality issues and improve them.
Our Obsession to Improve Data Quality

As you can already tell, we’re obsessed with solving this pressing data problem for the AI industry. First, we open-sourced our synthetic data engine and built a community around it. Synthetic data can help create high-quality data, but what happens to the existing real-world messy data?
What if we could analyze the data for standard quality issues and flag them by priority upfront, saving precious time for the data scientists? That’s the question we’d like to answer today.
Today, we are excited to announce YData Quality, an open-source python library for assessing Data Quality throughout the multiple stages of a data pipeline development.
The Core Features: What’s inside?
The package is handy, especially in the initial stages of development when you’re still grasping the value of the available data. We can only capture a holistic view of the data through a look at data from multiple dimensions. YData Quality evaluates it modularly — specific modules for each dimension, finally wrapped into a single data quality engine.
The quality engine performs several tests on the input data, and warnings are raised depending on the data quality. A warning will contain not only the details of the detected issue but also a priority level based on the expected impact.
Here’s a quick overview of the core modules in YData Quality:
- Bias and Fairness: Guarantees that data is not biased and its application is fair concerning sensitive attributes for which there are legal and ethical obligations not to differentiate the treatment (e.g., gender, race).
- Data Expectations: Unit tests for data that assert a particular property. Leverage Great Expectations validations, integrate their outcomes in our framework and check the quality of the validations.
- Data Relations: Check the association between features, test for causality effects, estimate the feature importance, and detect features with high collinearity.
- Drift Analysis: Often, with time, different patterns may evolve from the data. Using this module, you can check the stability of your features (i.e., covariates) and target (i.e., label) as you look at different chunks of data.
- Duplicates: Data may come from different sources and is not always unique. This module checks for repeated entries in data that are redundant and can (or should) be dropped.
- Labellings: With specialized engines for categorical and numerical targets, this module provides a test suite that detects both common (e.g., imbalanced labels) and complex analysis (e.g., label outliers).
- Missings: Missing values can cause multiple problems in data applications. With this module, you can better understand the severity of their impact and how they occur.
- Erroneous Data: Data may contain values without inherent meaning. With this module, you can inspect your data (tabular and time-series) for typical misguided values on data points.
How Do I Get Started?
This is the part we all love. Fire up your terminal and type the following:
pip install ydata-quality
You have all the data quality engines installed in a single command. To walk you through various library usages, we have included multiple tutorials presented as jupyter notebooks.
Let us give you a flavor of how our data quality engine works:

And here’s how a sample report looks like:
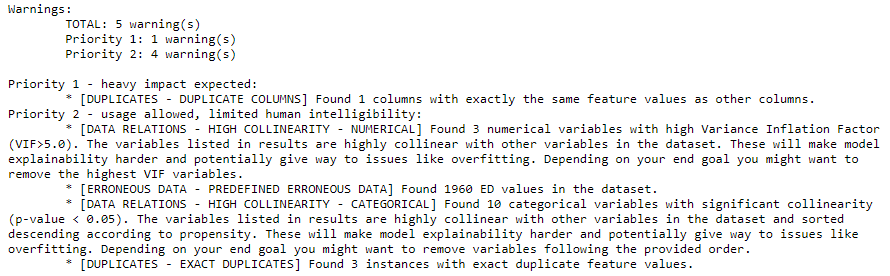 From the above output, we notice that duplicated column is a high-priority issue and needs further inspection. To this, we use the
 get_warnings() method.
Simply type in the following:
dq.get_warnings(test="Duplicate Columns")
We can see the detailed output specific to the issue we want to resolve:
[QualityWarning(category='Duplicates', test='Duplicate Columns', description='Found 1 columns with exactly the same feature values as other columns.', priority=<Priority.P1: 1>, data={'workclass': ['workclass2']})]
Based on the evaluation, we can see that the columns workclass and workclass2 are entirely duplicated, which can have serious consequences downstream. We must drop the duplicated column and move on to the next identified issue based on its priority.
We saw how the package could help data scientists fix data quality issues by flagging them upfront with the details. Further, we recommend starting with this tutorial notebook that evaluates a messy dataset for data quality issues and fixes them.
Got any questions? Join our dedicated Community Slack space and ask away everything. We’re a friendly bunch of people looking to learn from each other and grow in the process.
Accelerating AI with improved data is at the core of what we do, and this open-source project is yet another step towards our meaningful journey. We invite you to be part of it — together, the possibilities are endless.
This blog has been republished by AIIA. To view the original article, please click HERE.
Recent Comments