By: Aparna Dhinakaran & Barr Moses
As data and machine learning ecosystems become increasingly complex and companies ingest more and more data, it’s important that data and ML engineering teams go beyond monitoring to understand the health of their data-driven systems.
One duplicate data set or stale model can cause unintended (but severe) consequences that monitoring alone can’t catch or prevent. The solution? Observability. Here’s how it differs from traditional monitoring and why it’s necessary for building more trustworthy and reliable systems.
Garbage in, garbage out. It’s a common saying among data and ML teams for good reason—but in 2021, it’s no longer sufficient.
Data (and the models it powers) can break at any point in the pipeline, and it’s not enough to simply account for data quality issues at ingestion. Similarly, when you’re deploying ML models, a myriad of issues can arise that weren’t seen during testing or validation, not just with the data itself.
And when you don’t know that something broke in your environment – let alone how it happened – it compromises the integrity of your analytics and experiments, not to mention the trust of your stakeholders.
For businesses, this can mean a loss of revenue, wasted resources, and ill-informed decision-making. In real-world applications, the consequences of ML models powered by bad data can be even more consequential. For example, in 2020, a Black man in Detroit was wrongfully arrested and jailed after being misidentified by facial-recognition software, likely due to bias issues that include training datasets that are predominately white and male.
And the problem of bad data in ML is undeniably widespread. MIT recently took down their entire 80 Million Tiny Images dataset due to racist, sexist, and offensive labels, and the massive ImageNet library removed over 600,000 images after the online art project ImageNet Roulette revealed similar problems. These datasets have been used to train ML models for years—deeply flawed labels and all.
Data quality issues are common because they’re difficult to solve. Maintaining clean, quality data at the scale needed for most data and ML projects is incredibly time-consuming—and without the right approach, near to impossible. Here’s where observability comes in.
Defining observability
An easy way to frame the effect of “garbage data” (no matter where it lives in your system) is through the lens of software application reliability. For the past decade or so, software engineers have leveraged targeted solutions like New Relic and DataDog to ensure high application uptime (in other words, working, performant software) while keeping downtime (outages and laggy software) to a minimum.
In data, we call this phenomena data downtime. Data downtime refers to periods of time when data is partial, erroneous, missing, or otherwise inaccurate, and it only multiplies as data systems become increasingly complex, supporting an endless ecosystem of sources and consumers. In ML, we see this in various model failure modes such as performance degradations or model drift. Model drift refers to periods of time when distributions of features or predictions have shifted from the baseline.
By applying the same principles of software application observability and reliability to data and ML, these issues can be identified, resolved and even prevented, giving data and ML teams confidence to deliver valuable insights.
Data monitoring vs. data observability
One question that comes up a lot is: “I already monitor my data. Why do I need observability, too?”
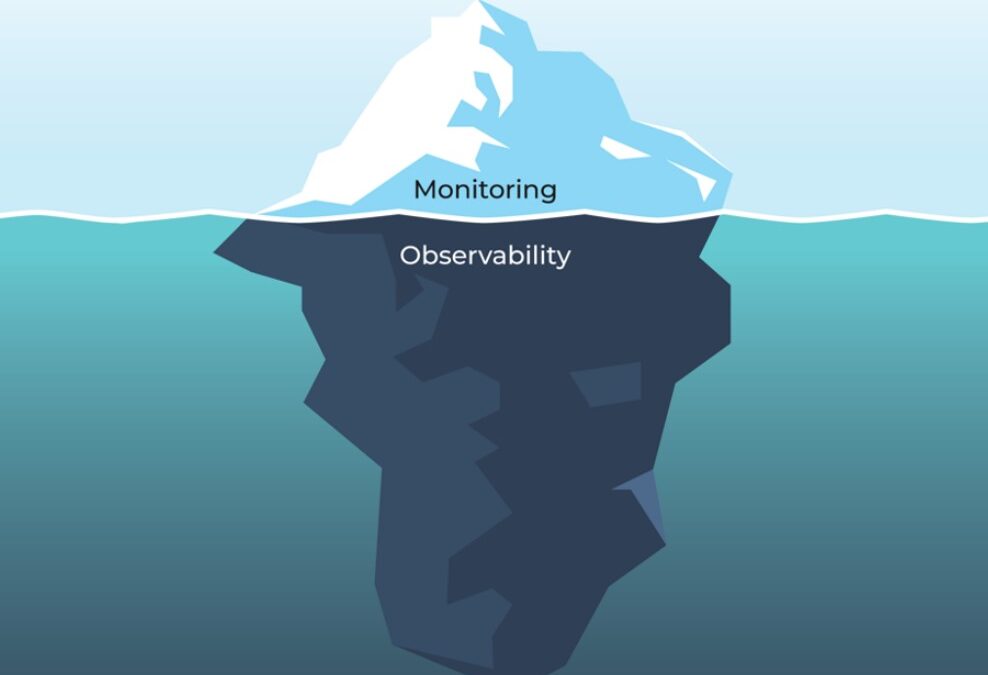
It’s a good question. For so long, the two have been used interchangeably, but monitoring and observability are two very different things.
Data observability enables monitoring, which is familiar to most technical practitioners: we want to be the first to know when something breaks, and to troubleshoot quickly. Data quality monitoring works in a similar way, alerting teams when a data asset looks different than the established metrics or parameters say it should.
For example, data monitoring would issue an alert if a value falls outside an expected range, data hasn’t updated as expected, or 100 million rows suddenly turn into 1 million. But before you can set up monitoring for a data ecosystem, you need visibility into all of those attributes we’ve just discussed—here’s where data observability comes in.
Data observability also enables active learning by providing granular, in-context information about data. Teams can explore data assets, review schema changes, and identify root causes to new or unknown problems. By contrast, monitoring issues alerts based on pre-defined problems, representing data in aggregates and averages.
With data observability, companies gain insight into five key pillars of data health: freshness, distribution, volume, schema, and lineage. For machine learning practitioners, observability helps provide a level of confidence that the data feeding your models is complete and up-to-date, and falls within accepted ranges.

And when problems do arise, visibility into schema and lineage helps swiftly answer pertinent questions about what data was impacted; what changes may have been made, when, and by whom; and which downstream consumers may be impacted.
Observability incorporates monitoring across the five pillars of data health, but also alerting and triaging of issues and end-to-end, automated data lineage. Applied together, these functionalities are what make data observability a must-have for the modern data stack.
One null value spoils the bunch
It’s one thing to know that your data pipeline broke. But how can you actually figure out what happened and why?
Unlike monitoring, data observability can be used to handle root cause analysis when data pipelines break. In theory, root-causing sounds as easy as running a few SQL queries to segment your data, but in practice, this process can be quite challenging. Incidents can manifest in non-obvious ways across an entire pipeline and impact multiple, sometimes hundreds, of tables.
For instance, one common cause of data downtime is freshness – i.e. when data is unusually out-of-date. Such an incident can be a result of any number of causes, including a job stuck in a queue, a time out, a partner that did not deliver its dataset timely, an error, or an accidental scheduling change that removed jobs from your DAG.
By taking a historical snapshot of your data assets, data observability gives you the approach necessary to identify the “why?” behind broken data pipelines, even if the issue itself isn’t related to the data itself. Moreover, the lineage afforded by many data observability solutions gives cross-functional teams (i.e., data engineers, data analysts, analytics engineers, data scientists, etc.) the ability to collaborate to resolve data issues before they become a bigger problem for the business.
ML monitoring vs. ML observability
Data observability is one piece of the puzzle when it comes to trusting your data in production, but what about your ML models?
Similar to how data observability helps answer the why, ML observability enables model owners to do root cause analysis of model failures. Monitoring alerts you when the performance of your model is degrading. ML Observability helps you get to the bottom of why. Figuring out what needs to be done once an issue arises is the bigger, harder problem.
With software applications, you are typically looking at SLAs and application downtimes. For machine learning, you are looking at deviations in data and performance from baselines.
ML observability allows teams to set baselines from training, validation, or prior time periods in production and compare shifts to root cause performance degradation.
With ML observability, companies gain insight into the main pillars of model health: model and feature drift detection, input and output data quality, model performance, and explainability.
When problems arise, ML observability gives practitioners the ability to pinpoint why a model’s performance is not as expected in production as well as clear signals for when they should retrain their model, update their training datasets, add new features to their model, or even go back to the drawing board.
Find the Needle in the Haystack
So how does ML observability work? Let’s take an example: Your model that predicts if a transaction is fraud goes off the rails and starts to have more false positives. How do we get to the bottom of why?
Being able to automatically surface up cohorts where the performance is low is critical to track down why the model performs better or worse for a particular subset of your data. ML observability helps you narrow down whether there are significantly more false positives occurring in a certain geographic region, a particular segment of customers, or a particular time window.
One common cause of performance degradation is drift. Because models are trained on data, they perform well when the data is similar to what they’ve already seen. Observability compares distribution changes between a baseline distribution and a current distribution. Model owners can do targeted upsampling when there is drift.
In theory, root-causing sounds easy in a Jupyter Notebook, but in practice you have to scale this to 100’s of features, models and model versions across billions of predictions, with automated setup and instant analysis.

The future of observability
Don’t get us wrong: monitoring is a critical component for any data-dependent system. But monitoring alone, even when automated, is insufficient for identifying the “why?” behind your broken data pipelines, failed ML models, and any other issue that arises with your data and ML initiatives.
We’re excited to see how the next generation of data and ML leaders approach this problem to make answering this question — and many others — much easier.
This blog has been republished by AIIA. To view the original article, please click HERE.
Recent Comments