We all know that our model’s best day in production will be its first day in production. It’s simply a fact of life that over time model performance degrades. ML attempts to predict real-world behavior based on observed patterns it has trained on and learned. But the real world is dynamic and always in motion; sooner or later, depending on your use case and data velocity, your model will decay and begin to exhibit concept drift, data drift, or even both.
This article will demonstrate how data science and ML engineering teams can leverage ML monitoring to find the best data and retraining strategy mix to resolve machine learning performance issues. This data-driven, production-first approach enables more thoughtful retraining selections, shorter and leaner retraining cycles, and can be integrated into MLOps CI/CD pipelines for continuous model retraining upon anomaly detection.
Matching production insights to retraining strategies
The insights explained below are based on anomalies detected in the Superwise model observability platform and analyzed in a corresponding jupyter notebook that extracts retraining insights. All the assets are open for use under the Superwise community edition, and you can use it to run the notebook on your own data.
* It’s important to note that the value of this approach lies in identifying how to best retrain once you have eliminated other possible issues in your root cause investigation.
Identifying retraining groups
The question? What data should I use for the next retraining?
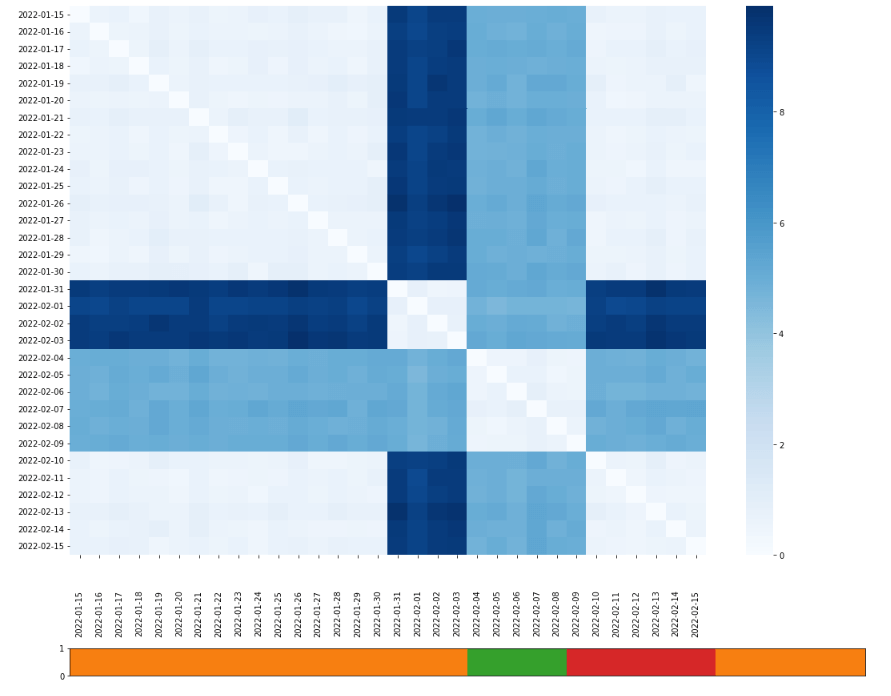
Models are subject to temporality and seasonality. Selecting a dataset impacted by a temporal anomaly or flux can result in model skew. An important insight from production data is data DNA or the similarity of days distribution. Understanding how data is changing between dates (drift score between dates) enables date-based grouping based on similarities and differences. With this information, you can create a combination of data retraining groups that reflect or exclude the temporal behavior of your production data.
Here we can see a heatmap plot matrix of dates X dates, and each cell represents the change between 2 dates. Cells colored in bold are very different from each other, while cells that are colored lightly represent dates that are very similar to each other.

As you can see in this example, the data is divided into 3 main groups, orange, red, and green, representing the 3 optional datasets to use in the next retraining.
- Red – the red group, reflects a recurring event in our data that we want to train on. This could be, for example, behavior over the weekends.
- Orange – the orange group is normal data behavior in production.
- Green – the green group, represents a unique behavioral event. For example, this could be a marketing campaign in a click-through rate optimization use case.
Depending on your domain insights, the include/exclude decisions may differ. If the marketing campaign was successful and the insights will be rolled-out to all marketing campaigns, you may decide to retrain green and red. If the campaign was a one-time event or a failed experiment, orange and red would be a better retraining data group selection.

Identifying drifted segments
The question? Which populations are impacted?
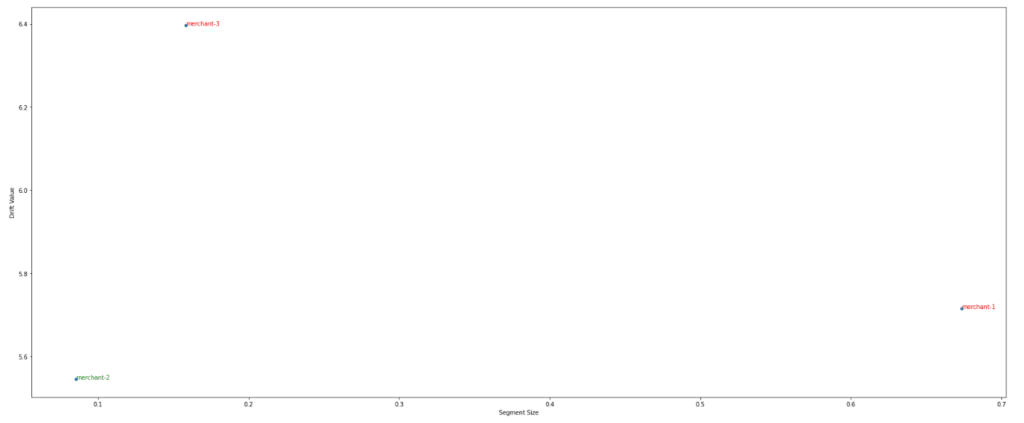
A model’s purpose is to abstract predictions across your population, but with that said, you will always need to monitor your model’s behavior on the segment level to detect if a specific segment is drifting. When segment drift is detected, we can consider the following resolutions or even a combination of them, together with retraining.
- Model split – create a specific model for the segment.
- Optimize the model – suit the model to handle the current segment.
- Resample the data – change the data distribution that the model will learn on data for the specific model.
Here we can see the segment drift value where each bar shows the drift score of each segment. Before taking action, it is important to understand the relationship of the segment size to the segment drift to determine the extent of the segment’s effect on the model.

Moreover, this lets us see the relation of segment size to the segment drift value and determine if we need to create a specific model for this segment or not.

Identifying days with integrity issues
The question? Which days should be excluded from retraining on principle?
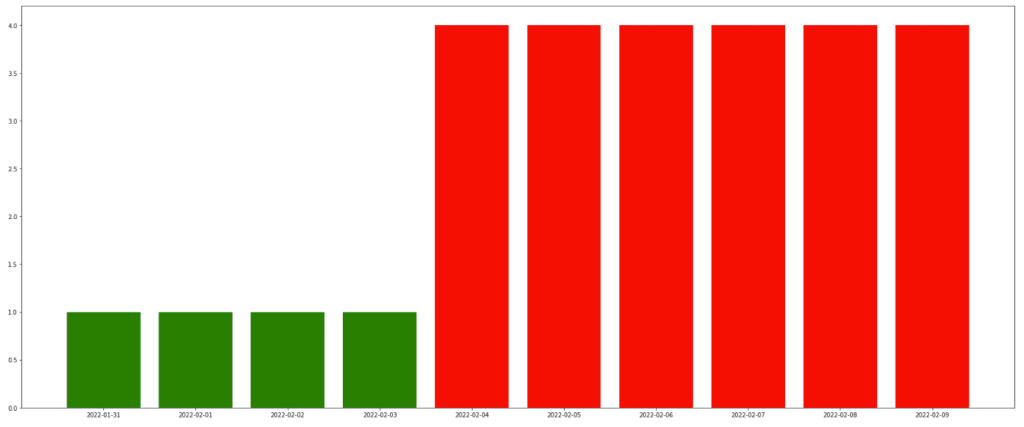
Some data should be excluded from retraining on principle, namely days when we experienced data integrity issues due to some pipeline or upstream source issue. If this data is taken into consideration during retraining, it can cause our model to misinterpret the ‘normal’ distribution, which can result in a further decline in model performance.

Here we can see a bar graph of the days with data integrity incidents. This lets us quickly identify ‘bad’ data that we should exclude from the next retraining.
Smarter, leaner retraining
Retraining isn’t free. It takes up resources both in terms of training runs and your team’s focus and efforts. So anything that we can do to improve the probability of finishing a retraining cycle with higher-performing results is crucial. That is the value of data-driven retraining with production insights. Smarter and leaner retraining that leverages model observability to take you from detection quickly and effectively.
This blog has been republished by AIIA. To view the original article, please click HERE.


Recent Comments