If you’ve worked in the AI industry with real-world data, you’d understand the pain. No matter how streamlined the data collection process is, the data we’re about to model is always messy.
According to IBM, the 80/20 Rule holds for data science as well. 80% of a data scientist’s valuable time is spent simply finding, cleansing, and organizing data, leaving only 20% of the time actually performing analysis.
Wrangling data isn’t fun. I know it’s crucial, “garbage in garbage out,” and all that, but I simply can’t seem to enjoy cleaning whitespaces, fixing regex expressions, and resolving unforeseen problems in data.
According to Google Research: “Everyone wants to do the model work, but not the data work” — I’m guilty as charged. Further, the paper introduces a phenomenon called data cascades which are compounding events causing adverse, downstream effects that arise from underlying data issues.
In reality, the problem so far is threefold:
- Most data scientists don’t enjoy cleaning and wrangling data
- Only 20% of the time is available to do meaningful analytics
- Data quality issues, if not treated early, will cascade and affect downstream
The only solution to these problems is to ensure that cleaning data is easy, quick, and natural. We need tools and technologies that help us, the data scientists, quickly identify and resolve data quality issues to use our valuable time in analytics and AI — the work we truly enjoy.
In this article, I’d present one such open-source tool that helps identify data quality issues upfront based on the expected priority. I’m so relieved this tool exists, and I can’t wait to share it with you today.
ydata-quality to the rescue

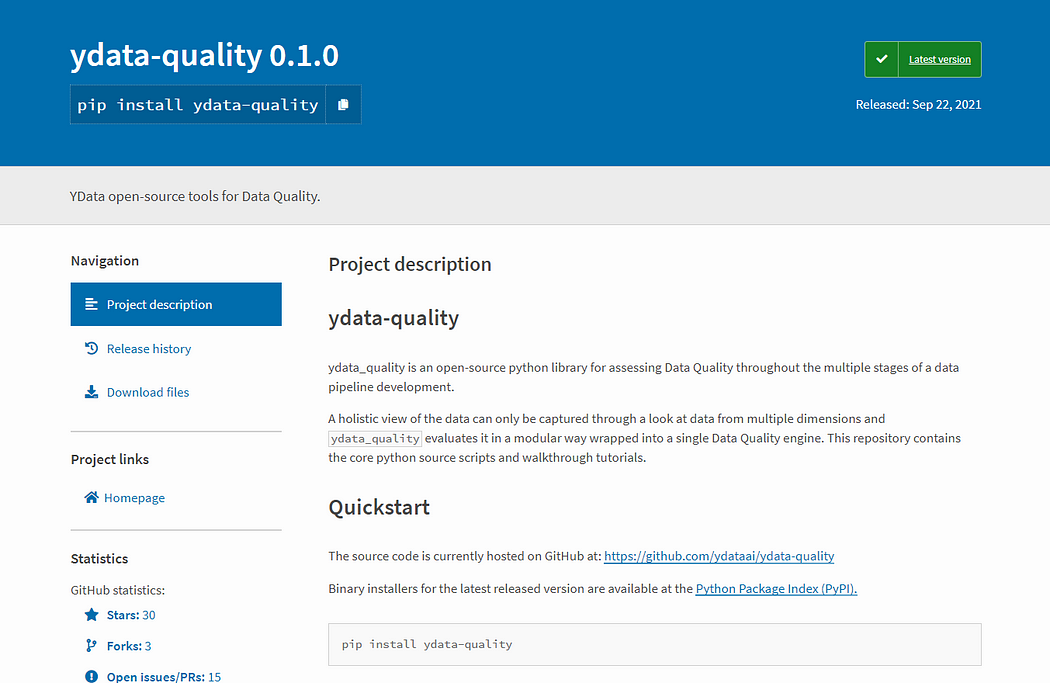
ydata-quality is an open-source python library for assessing Data Quality throughout the multiple stages of a data pipeline development. The library is intuitive, easy to use, and you can directly integrate it into your machine learning workflow.
To me personally, the cool thing about the library is the availability of priority-based ranking of data quality issues (more on this later), which is helpful when our time is limited, and we want to tackle high-impact data quality issues first.
Let me show you how to use a real-world example of messy data. In this example, we will:
- Load a messy dataset
- Analyze the data quality issues
- Dig further on to the warnings raised
- Apply strategies to mitigate them
- Check the final quality analysis on the semi-cleaned data
It’s always best to create a virtual environment using either venv or conda for the project before installing any library. Once that’s done, type the following on your terminal to install the library:
pip install ydata-quality
Now that your environment is ready let’s move on to the example.
A Real-world Messy Example

We will use the transformed census dataset for this example, which you can download from this GitHub repository. You can find all codes used in this tutorial in this Jupyter Notebook. I recommend you either clone the repository or download the notebook to follow along with the example.
Step 1: Load the dataset
As a first step, we will load the dataset and the necessary libraries. Note that the package has multiple modules (Bias & Fairness, Data Expectations, Data Relations, Drift Analysis, Erroneous Data, Labelling, and Missing) for separate data quality issues, but we can start with the DataQuality engine, which wraps all the individual engines into a single class.
from ydata_quality import DataQuality
import pandas as pddf = pd.read_csv('../datasets/transformed/census_10k.csv')
Step 2: Analyze its quality issues
This is supposed to be a lengthy process, but the DataQuality engine does an excellent job of abstracting all the details. Simply create the main class and call the evaluate() method.
# create the main class that holds all quality modules
dq = DataQuality(df=df)# run the tests
results = dq.evaluate()
We would be presented with a report with the data quality issues.
- Warnings: These contain the details for issues detected during the data quality analysis.
- Priority: For every detected issue, a priority is assigned (a lower value indicates high priority) based on the expected impact of the issue.
- Modules: Every detected issue is linked to a data quality test carried out by a module (Eg: Data relations, Duplicates, etc.)
Tying everything together, we notice five warnings have been identified, one of which is a high-priority issue. Detected by the “Duplicates” module, we have an entirely duplicated column that will need fixing. To dive deeper into this issue, we use the get_warnings() method.
Simply type in the following:
dq.get_warnings(test="Duplicate Columns")
We can see the detailed output specific to the issue we want to resolve:
[QualityWarning(category='Duplicates', test='Duplicate Columns', description='Found 1 columns with exactly the same feature values as other columns.', priority=<Priority.P1: 1>, data={'workclass': ['workclass2']})]
Based on the evaluation, we can see that the columns workclass and workclass2 are entirely duplicated, which can have serious consequences downstream.
Step 3: Analyze quality issues using specific modules
A complete picture of data quality requires multiple perspectives, and hence the need for eight separate modules. Though they are encapsulated in the DataQuality class, some modules will not run unless we provide specific arguments.
For example, DataQuality class did not execute Bias & Fairness quality tests since we didn’t specify the sensitive features. But the beauty of the library is, we can treat it as a standalone test and perform it.
Let’s understand it better by performing Bias and Fairness tests.
from ydata_quality.bias_fairness import BiasFairness#create the main class that holds all quality modules
bf = BiasFairness(df=df, sensitive_features=['race', 'sex'], label='income')# run the tests
bf_results = bf.evaluate()
When we ran the code above, we generated another similar report specific to the chosen module.
From the report, we understand that we may have a proxy feature leaking information about a sensitive attribute and severe under-representation of feature values of a sensitive attribute. To investigate the first warning, we can fetch more details with the get_warnings() method filtering for a specific test.
bf.get_warnings(test='Proxy Identification')
We can see the detailed output specific to the issue we want to resolve:
[QualityWarning(category='Bias&Fairness', test='Proxy Identification', description='Found 1 feature pairs of correlation to sensitive attributes with values higher than defined threshold (0.5).', priority=<Priority.P2: 2>, data=features
 relationship_sex    0.650656
 Name: association, dtype: float64)]
Based on the detailed warning, we inspect the columns relationship and sex and notice that some relationship statuses (e.g., Husband, Wife) are gender-specific, thus impacting the correlation. We could change these categorical values to be gender-neutral (e.g., Married).
Step 4: Resolving the identified issues
Let’s be practical. We can never have 100% cleaned data. It’s all about tackling down the most impactful issues in the time available. As a data scientist, it’s a decision that you need to take based on your constraints.
For this example, let’s aim to have no high priority (P1) issues and tackle at least one bias and fairness warning. A simple data cleaning function based on the warnings raised can look as below:
We drop the duplicated column work_class2and replace the relationship values to be more general and gender-neutral.
If you’d like to do further data cleaning, please feel free to. I would love to see how the data cleaning looks like, should you chose to progress further. Remember, you’re the data scientist — and that decision is always in your hand.
Step 5: Run a final quality check
You may skip this step, but I’m in peace of mind when I check my processed data through another final check. I highly recommend you do it, too, so you know the status of the data after completing your data cleaning transformations.
You can simply call the quality engine first and the evaluate() method to retrieve the sample report again. Here’s how the reports for the DataQuality engine and the BiasFairness engine look like after we have cleaned the data.
We can infer from the two reports above that our high-priority issue has been resolved, and another lower priority issue has been resolved as we aimed for.
Concluding Thoughts

Look, just because we hate to clean data doesn’t mean we quit doing that. There’s a reason it’s an integral phase of the machine learning workflow, and the solution is to integrate valuable tools and libraries such as ydata-quality into our workflow.
In this article, we learned how to use the open-source package to assess the data quality of our dataset, both with the DataQuality main engine as well as through a specific module engine (e.g. BiasFairness). Further, we saw howQualityWarning provides a high-level measure of severity and points us to the original data that raised the warning.
We then defined a data cleaning pipeline based on the data quality issues to transform the messy data and observed how it solved the warnings we aimed for.
The library was developed by the team at YData, which is on a mission to improve data quality for the AI industry. Got further questions? Join the friendly slack community and ask away all the questions directly from the developing team (you can find me there too!)
Together we can definitely improve the library, and your feedback would mean that the library solves most of your pressing problems in the future. I can’t wait to see you use the library and hear your feedback inside the community.
This blog has been republished by AIIA. To view the original article, please click HERE.


Recent Comments